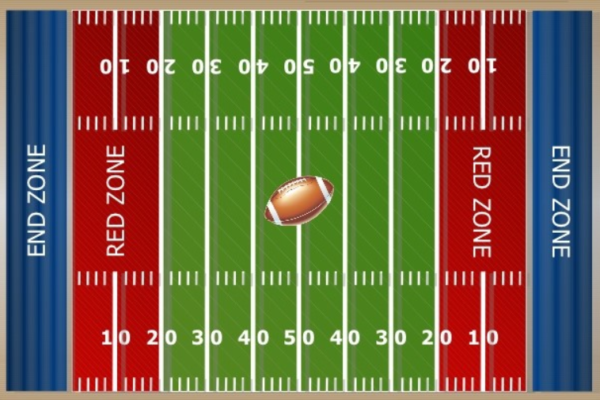
Sequence of Returns Risk 

Since bear markets or down cycles are inevitable, investors must be aware of the Retirement Red Zone, also known as “sequence of returns” risk. 

Put simply, Sequence of Returns Risk is the risk that you suffer large losses in your portfolio in the early part of your retirement, rather than 15 or 20 years into it.

There is a huge difference in suffering a large decline in portfolio values in your early to mid-’60s versus in your early to mid-’80s…

Financial Planning

Here is a look at how serious Sequence of Return Risk can be

Example ⇒

As you can see, if you need to keep withdrawing money from your portfolio for living expenses when it has suffered a big decline it can be very difficult or impossible to recover from…and depending on the size of your nest egg and spending, you can actually run out of money.

Does your portfolio look like this?

Example – $1,000,000

Financial Planning

Hoping the markets treat you well throughout retirement… Is not a strategy

In The Current Environment, Should It Look ... More Like This?

Example – $1,000,000

A look at the power of using indexing…

Is there a solution? How can you avoid Sequence of Returns Risk? How can you protect your nest egg against a crash of a prolonged period of poor or negative returns?

A look at the power of using indexing…

Excerpted and updated from THE RETIREMENT MIRACLE. 
A Great Retirement Book by Patrick Kelly (January 2011) (We encourage everyone to read Mr. Kelly’s retirement books!)

newcwnturyplanning.com

The “buy-and-hold” strategy is predicated on one very important principle: The market must return to new highs.
But what if that is not the case?  What if a bear market (one that goes down) were to last for is 15-20 years?  Does a traditional “buy-and-hold” strategy work in that environment?

Financial PlanningWell, let’s take a look.  Let’s consider the world’s third-largest economy behind the United States and China – Japan.

Japan’s leading stock index, the Nikkei 225, hit a high of 39,900 in December of 1989. As of early 2021, over 31 years after it touched its all-time high, the Nikkei 225 index stands at just 28,966 – still 27 percent below its closing high over three decades ago!! 

10 years ago, the Nikkei was trading at just $9,400, or about 76% below its all-time highs…after 21 years! As of early 2021, over 31 years after it touched its all-time high, the Nikkei 225 index stands at just 28,966 – still 27 percent below its closing high over three decades ago!! So, how did the “buy and hold” strategy work for those Japanese investors who placed their money in the market back in December 1989? 

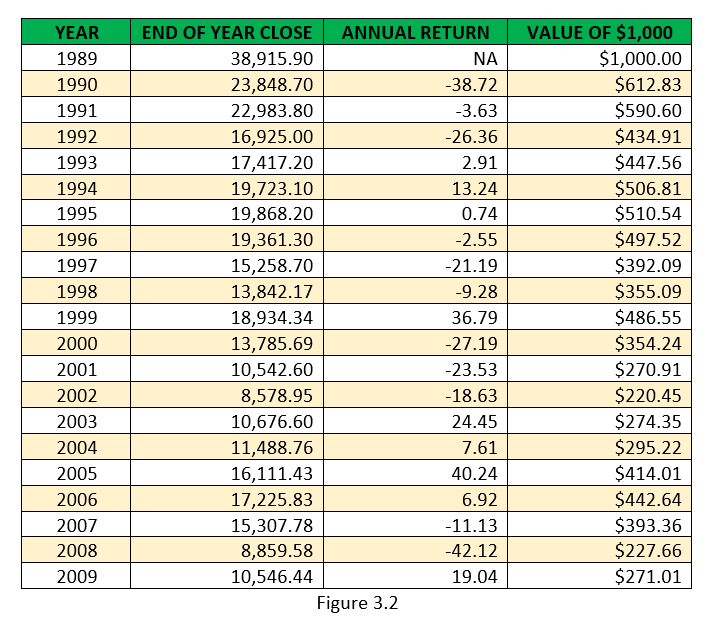
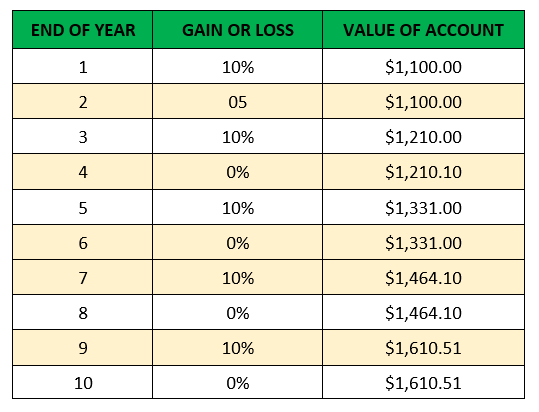
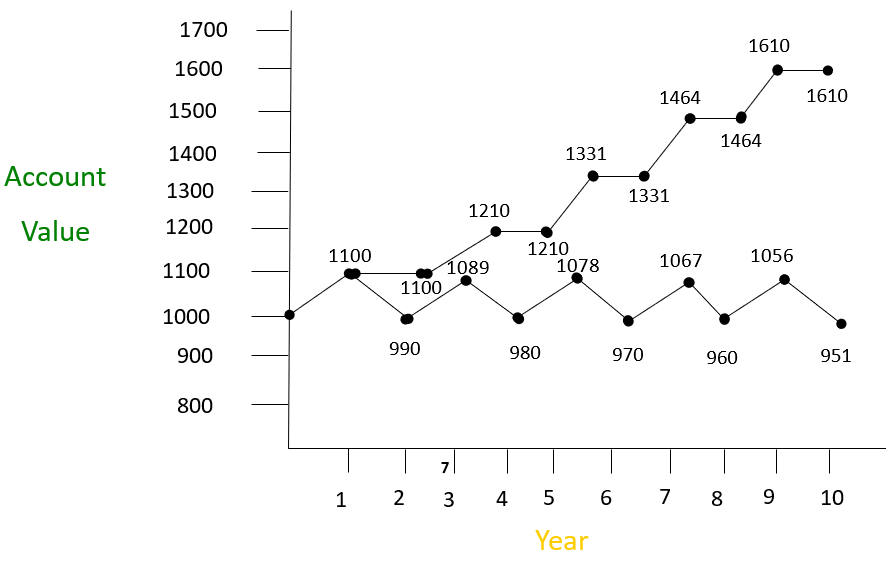
Let’s look graphically at what Patrick Kelly’s book showed us in terms of what $1,000 would have been worth each year, over those first terrible 20 years, from 1989 through year-end 2009 (if it had simply been left in that market, tracking the Nikkei 225 index). 

The value of $1,000 in the Nikkei 225 from 12/31/1989 to 12/31/2009

That $1,000 of value in December of 1989 would be worth a measly $271 at year-end December 2009.  After two full decades!  And that doesn’t take into account the further, and significant, erosion from inflation.

You see, the traditional “buy-and-hold” strategy has no way of capturing those individual years of positive gain without factoring in all the negative years as well.

financial planning
The value of $1,000 in the Nikkei 225 form 12/31/1989 to 12/31/2009 (removing all negative years and capping returns at 14 percent)

Now, let’s have some fun.  Let’s adjust the returns we just looked at in the chart above by two factors.  First, let’s remove all negative years and make them simply zero – neither loss nor gain.  Second, let’s limit the gain in any single year to a maximum of 14 percent.

Now, before you inquire as to why we are doing this, let’s first look at those numbers.  The difference is staggering.

Can you believe the difference?

Can you believe the difference?  Only nine years had positive gains, and not one of them achieved greater than a 14 percent return; yet the amount of money that an individual would have in this scenario is 742 percent more than simply letting it ride with the traditional “buy-and-hold” strategy: $2,281 versus $271.  Which amount would you prefer after 20 years?

How was this immense anomaly possible?  Simple.  The second account never took losses. Can you believe the difference that simply eliminating the negative years makes?  It’s astounding.  But what if there was a way you could do exactly that?  A way to:

  1. Capture each year of positive gain, up to a certain cap or level, AND
  2. Eliminate each negative year, making your worst possible return 0 percent

Sounds impossible, doesn’t it?  Well, the good news, no the great news, is that it’s not only possible, it’s actually quite easy.  There is a product that will allow you to do exactly that.

Another Possibility – The Market Goes Sideways For a While…..

Even novice investors recognize that markets don’t just go up and just don’t go down.  They also travel sideways, neither up nor down, along their meandering course to who-knows-where.

Let’s take a look at how both the general stock market and an Indexed Universal Life Policy’s cash value would perform in a long-term choppy (sideways) market.

For this hypothetical example, let’s pretend each year alternated between a 10-percent gain and a 10-percent loss.  Could this really happen?  No, at least not with exact repetition; however, this will serve as a powerful teaching tool.

In this hypothetical example, the graph for those market returns would look like figure 11.1 below.

Here’s what’s interesting.  If an account performed in this manner, with a 10-percent gain in a year one, a 10-percent loss in year two, and then alternated back and forth that way for 10 years, its average return at the end of those 10 years would be zero. 
However, the actual return would be a negative 4.9 percent.  Yes, it would have lost money.  An account that started with $1,000 at the beginning of this 10-year period but experienced alternating years of 10-percent gain and 10-percent loss, would end up with an account value of only $950.99.  Crazy, isn’t it?

How can the same gain and same loss, alternating each year for 10 years, result in less money than an investor began with? 

If the average return on this account is 0 percent, doesn’t that mean it will end at its beginning value of $1,000 at the end of that roller coaster ride? 

Nope.  (Remember: The average return and the actual return will never equal one another if any negative numbers have to be factored into the equation.)  Here’s how the actual results would look, year by year:

Financial Planning

As you can see, the account continues to lose ground each and every two-year period.  Not only would that individual not see a single penny of gain, he would have actually experienced a 5-percent loss.  He would have been better off sticking that $1,000 into a coffee can and burying it in his back yard.

Now let’s see how this same market would look if we overlaid upon it the two principles that are offered by the Indexed strategy – no losses in negative market years, and capturing (and protecting) each positive year’s gain.  The difference is shocking.  Here are the numbers:                         

Wow!  This is the same market but radically different results.

Financial Planning

The percent of growth in the up years was the same in both scenarios – 10 percent; the only difference between these two charts is the fact that the Indexed Strategy never experienced a negative return.  Its worst year was zero.  And even though it only had five out of 10 years of gain, that initial $1,000 investment would have grown to $1,610.51 at the end of 10 years – a 61 percent gain in a market that had an average return of 0 percent, and a real return (loss) of -4.9 percent.

Do you see how powerful the Indexed strategy can be even in a choppy or sideways market?  Why?  Because in the year that the general market went down, the Indexed strategy stayed flat – it didn’t’ lose value.  Therefore, when the stock market grew the following year, the Indexed strategy was able to grow from the previous year’s high-water mark; it didn’t have to make up any losses just to get you back to even, because it never had any losses.  Let that sink in.  Really sink in.  It’s revolutionary.

To help you picture what this scenario looks like graphically, see figure below:

Financial Planning

And don’t let this fact slip by you; in this hypothetical example above, after 10 years, there would be 69.35 percent more money in the Indexed strategy than in a non-Indexed strategy.  So, not only does this product offer a safety net against loss, but it also provides the opportunity for remarkable growth, even in choppy and volatile markets.

NOTE:  This scenario above does not include any fees, costs, management expenses, or any other type of sales charge of any particular product on either side of the comparison.  Rather, it is simply a look at how the different strategies would perform in this type of market.  The only way to evaluate the actual costs, expenses, and opportunities available to you is to meet with a financial professional, who can run the various options side by side, so you can evaluate each and make the best decision for your financial future.

So, for the portion of your accumulated money that you do not want to go through a prolonged down cycle with, consider the use of fixed index annuities, which offer you the following potential benefits:

  • Guaranteed principal- when markets are negative, you get a zero
  • Guaranteed death benefit- if you have the misfortune of dying during a recession or depression, or market crash, your beneficiaries receive all of your invested capital, plus growth
  • Guaranteed income for life- this income can rise over time, and may be tax-free if converted to Roth status
  • No or low annual fees
  • Maintain control over underlying capital- if you change your mind down the road, for whatever reason, you can move any remaining fund wherever you’d like- you do not have to give up control of your capital in return for the lifetime income

As you can see, proper retirement planning can be complicated, and there are many pitfalls, contingencies, and risks to be aware of…and to address.

We are experienced in all of these aspects and can help you navigate through these confusing waters.