How does the government look at our money?
How is our Money Taxed?
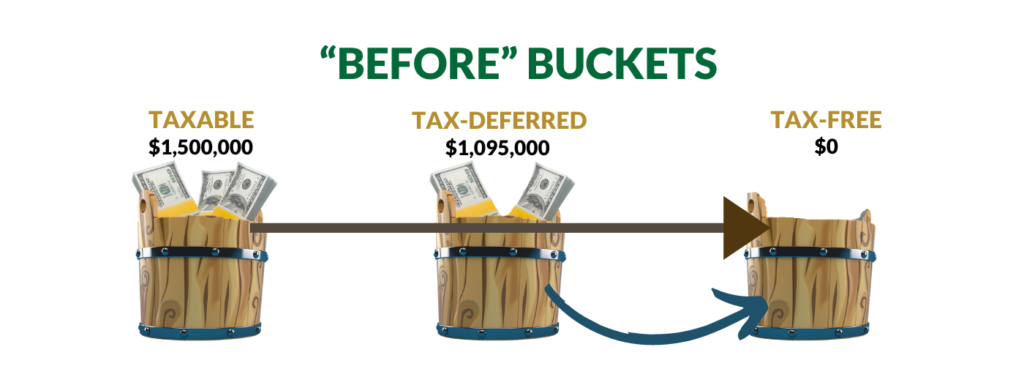
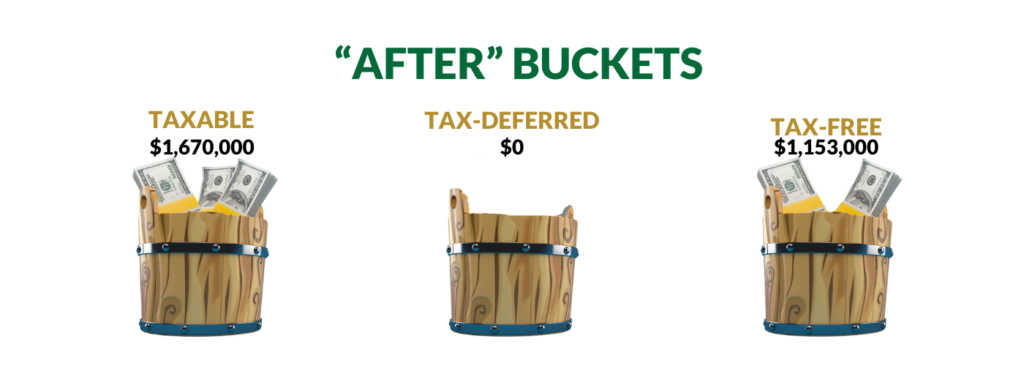
On this front, it is important to realize that the federal (and some state) government looks at our money in a certain way- in terms of how the money is taxed. In other words, from the government’s perspective, the average American can have money (more properly “assets”) in three different types of accounts, or “buckets”. For the money that is taxed every year, we use the name “the taxable bucket” and these holdings can include CDs/bonds, stock dividends, stock sales, rental income, real estate sales, mutual fund sales, savings bond redemptions, bank account interest and anything else that generates a tax form every year.
The second “bucket” includes all of the types of accounts in the middle bucket below. The third bucket-the tax-free bucket, unfortunately, has a much smaller list of possible holdings.
If the government looks at our money this way, so should we!

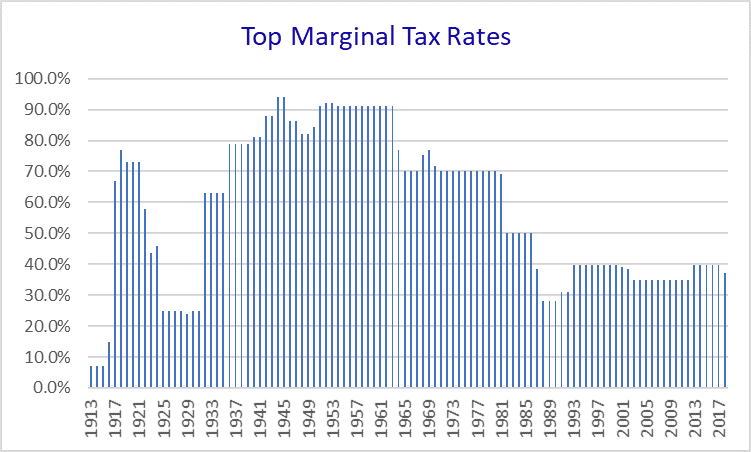
A History of Tax Rates
The impact of taxes in retirement
Many retirees underestimate the role taxes will play. In addition, given the country’s rapidly aging population and terribly high debt levels, it is increasingly likely that tax rates will go up, possibly significantly, in the coming years.
The IRS and the graduated income tax both came into existence in late 1913. Here is a look at the history of the highest marginal tax rates since then. Note that the high was an incredible 94% in 1944 and 1945 and that it was 70% as recently as the 1970s.
A look at today’s tax rates-attractive from a historical standpoint but expiring in less than 5 years on 12/31/25.
2017 Income Tax Rates and Brackets
| 2017 tax rate | Single | Married Filing Jointly |
|---|---|---|
| 10% | $0 to $9,325 | $0 to $18,650 |
| 15% | $9,325 to $37,950 | $18,650 to $75,900 |
| 25% | $37,950 to $91,900 | $75,900 to $153,100 |
| 28% | $91,900 to $191,650 | $153,100 to $233,350 |
| 33% | $191,650 to $416,700 | $233,350 to $416,700 |
| 35% | $416,700 to $418,400 | $416,700 to $470,700 |
| 39.60% | Over $418,400 | Over $470,700 |
2022 Income Tax Rates and Brackets
The 2017 tax act changed the tax rates and income ranges to which the rates apply.
| Tax Rate | Single | Married Filing Jointly |
|---|---|---|
| 10% | $0 to $10,275 | $0 to $20,550 |
| 12% | $10,275 to $41,775 | $20,550 to $83,550 |
| 22% | $41,775 to $89,075 | $83,550 to $178,150 |
| 24% | $89,075 to $170,050 | $178,150 to $340, 100 |
| 32% | $170,050 to $215,950 | $340, 100 to $431,900 |
| 35% | $215,950 to $539,900 | $431,900 to $647,850 |
| 37% | Over $539,900 | Over $628,301 |
2022 Standard Deductions
| Filing Status | Deduction Amount | |
|---|---|---|
| Single | $12,950 + $1,750 over 65 = | $14,700 |
| Married Filing Jointly | $25,900 + $1,400 (each) over 65 = | $28,700 |
| Head of Household | $19,400 |
Contact Us Now!
Our team excels in offering professional guidance for strategic tax planning, essential for protecting your wealth from potential inflationary pressures and for enhancing your financial portfolio through intelligent tax maneuvers.
We are keenly focused on employing tax-efficient investment strategies, like investing in municipal bonds and optimizing retirement account contributions, in response to the expansive fiscal and monetary policies enacted by the US and other global governments.
If you aim to efficiently manage your taxes and ensure a financially stable retirement...
